Tutorial on Scholarly Data Visualization
August 9, 2025 @ Yonsei University
The Center for Science and Technology Studies hosted a tutorial on scholarly data visualization using Korean Citation Index (KCI) data with Tableau on August 9.
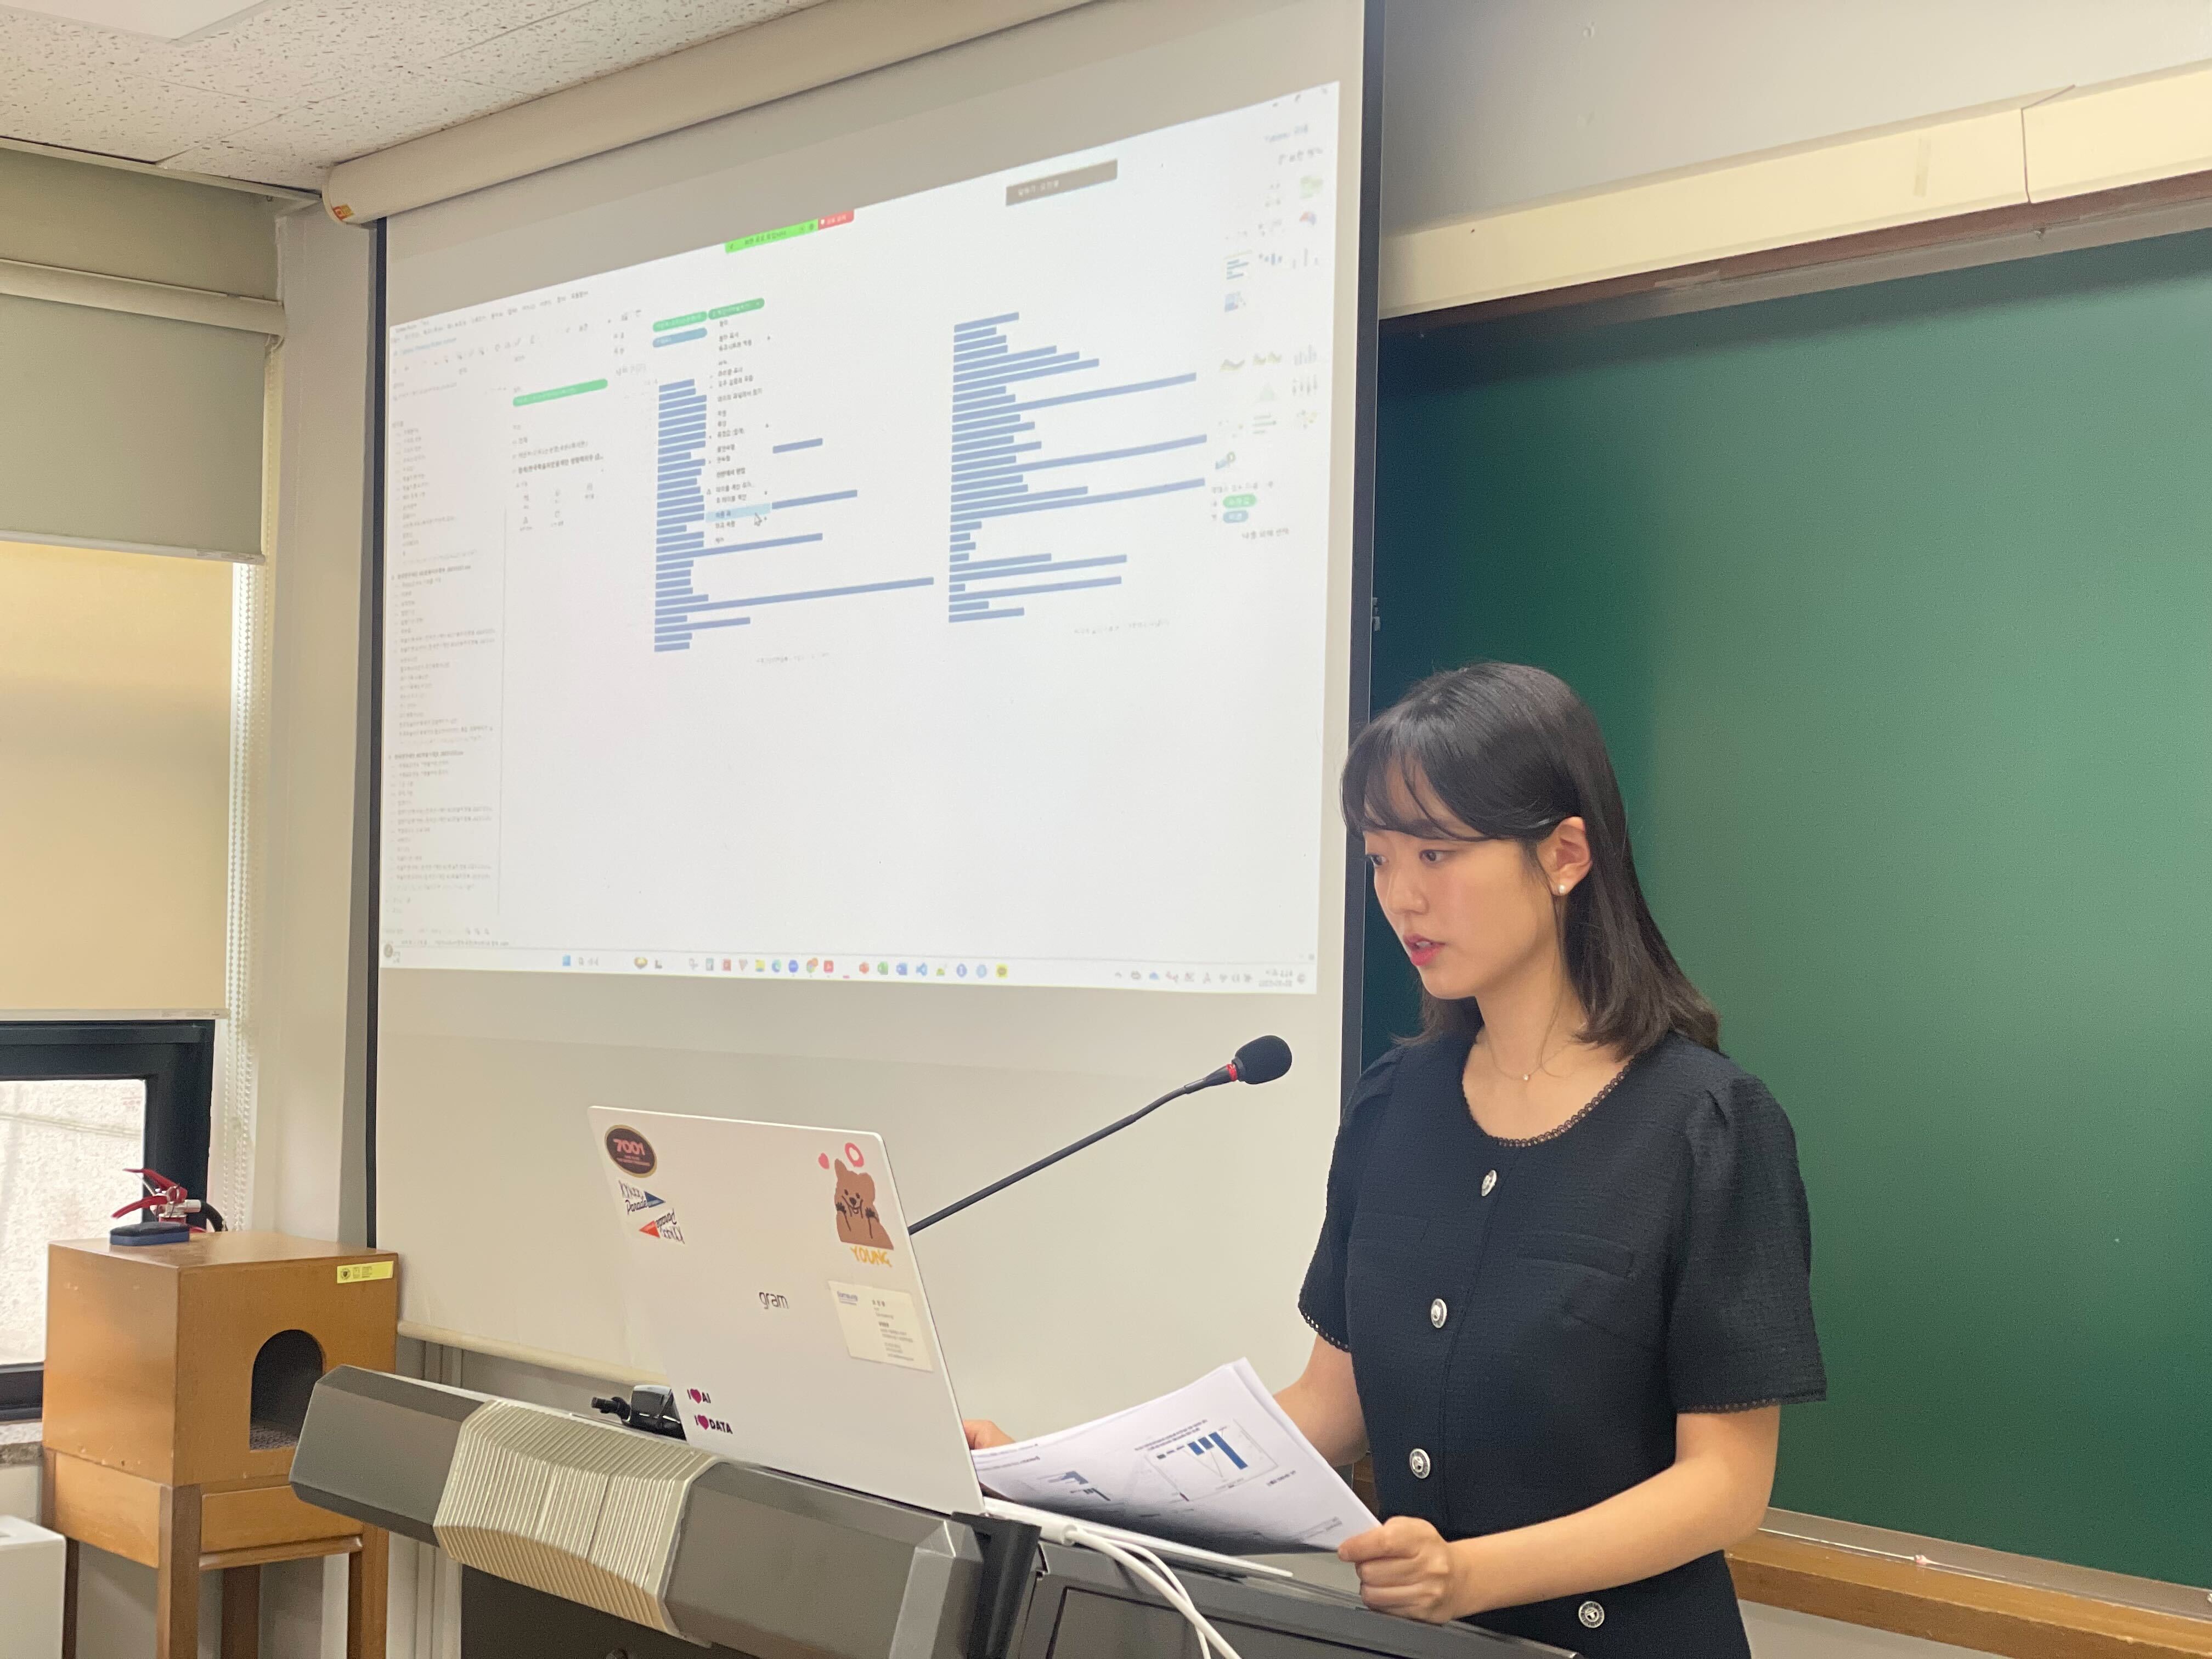 Researcher Jinyoung Oh opens the tutorial on building visualizations from KCI data.
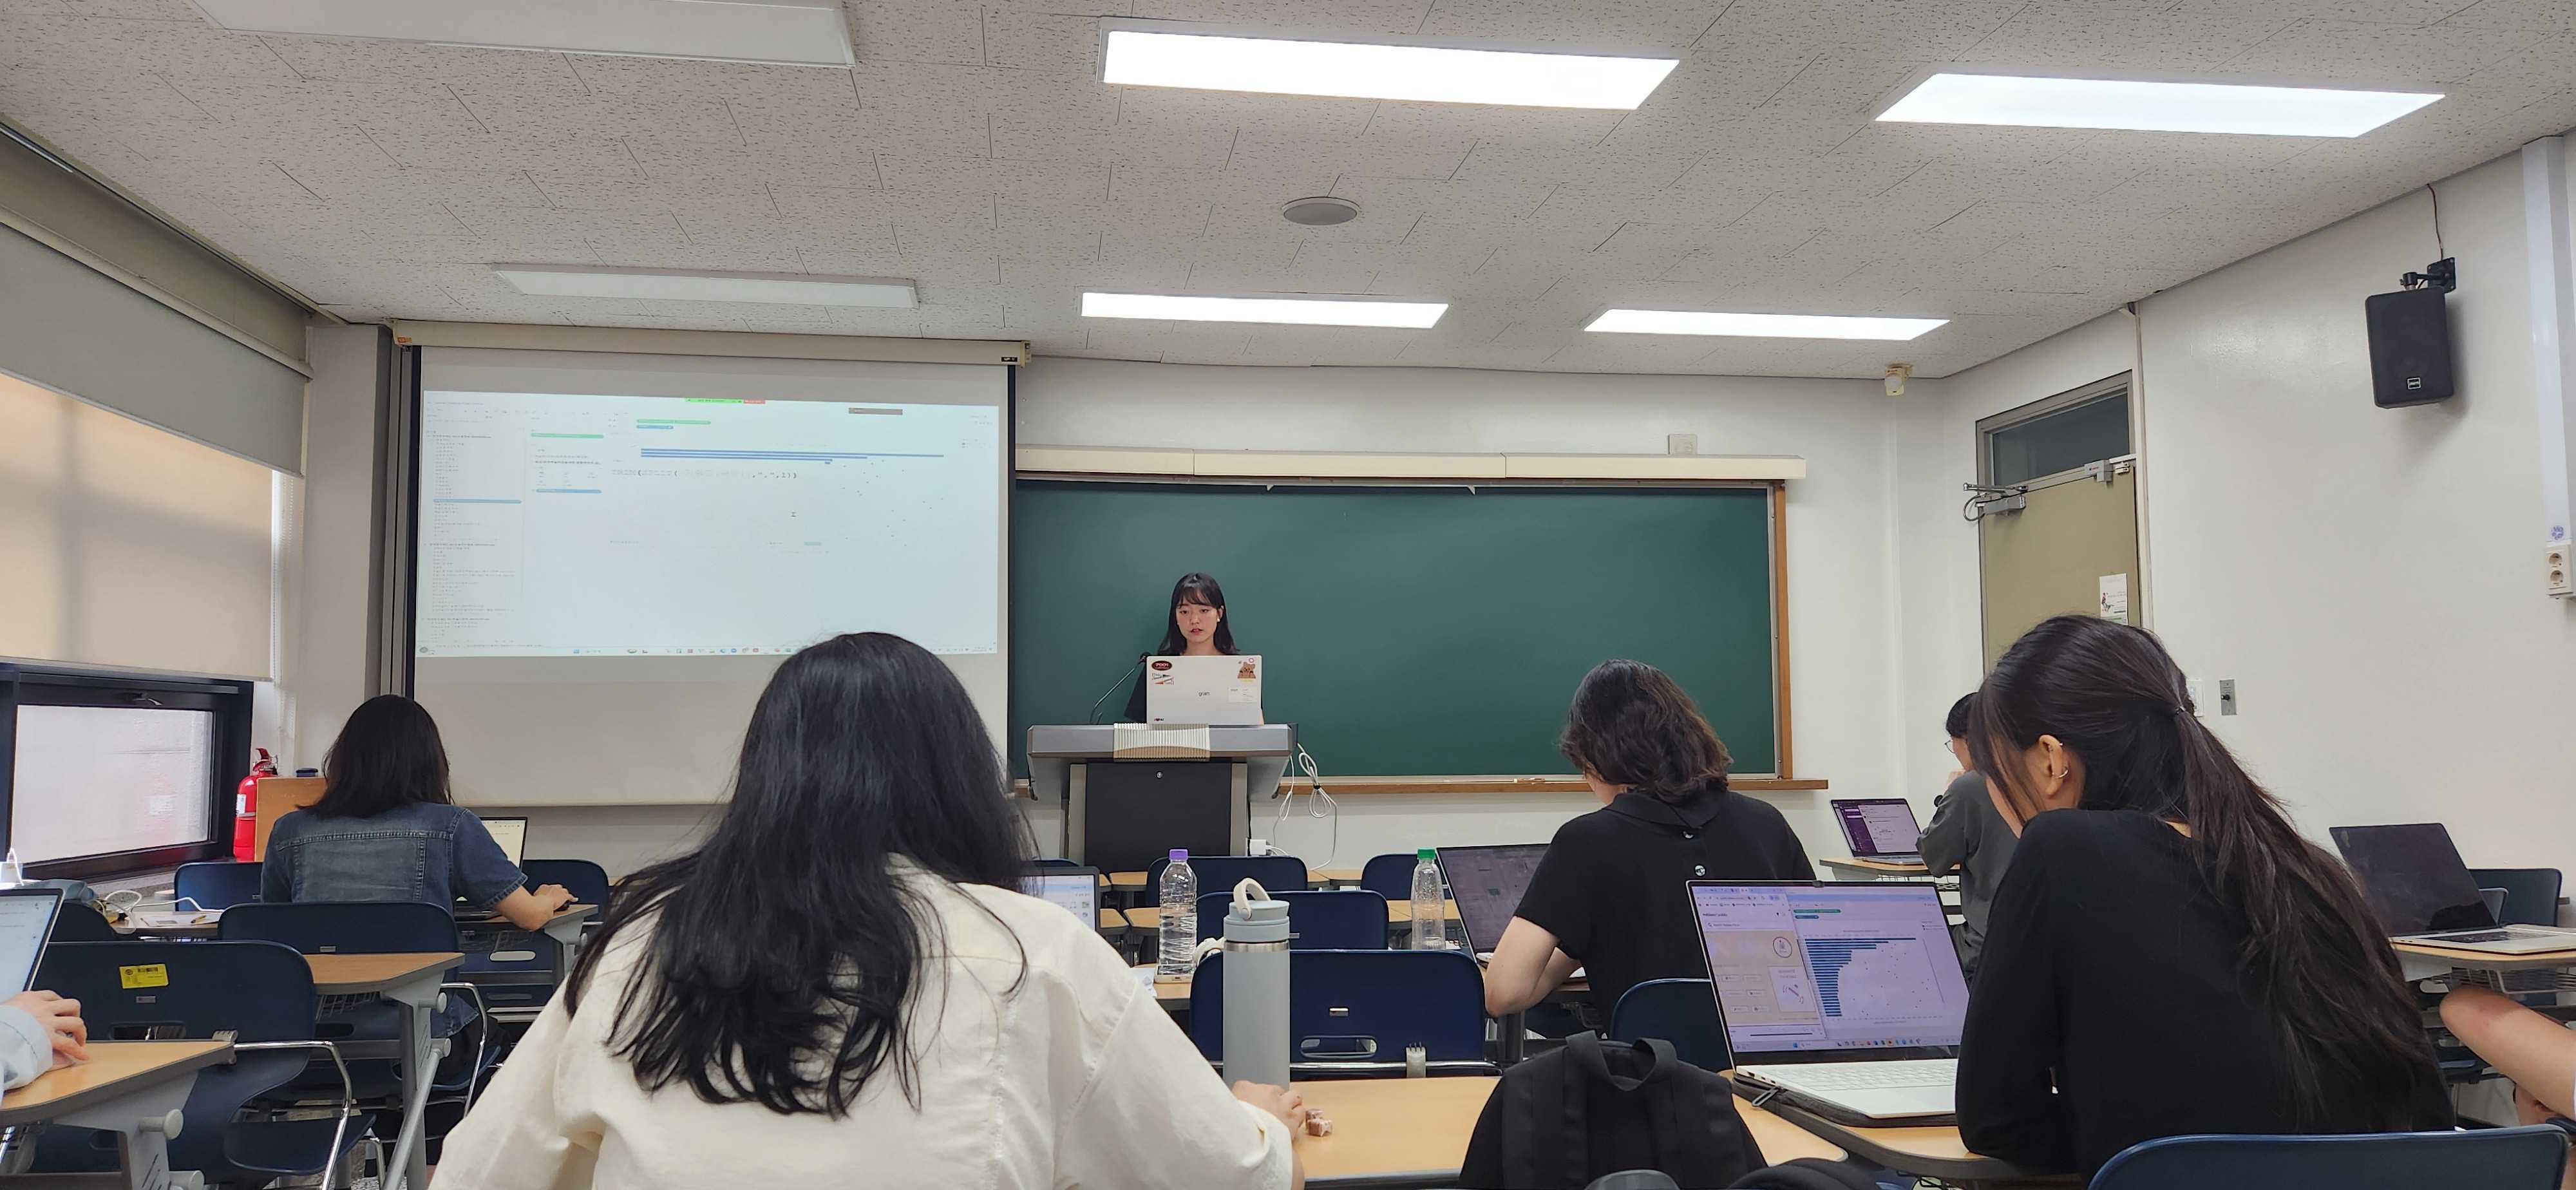 Participants follow along, building their own Tableau visualizations.
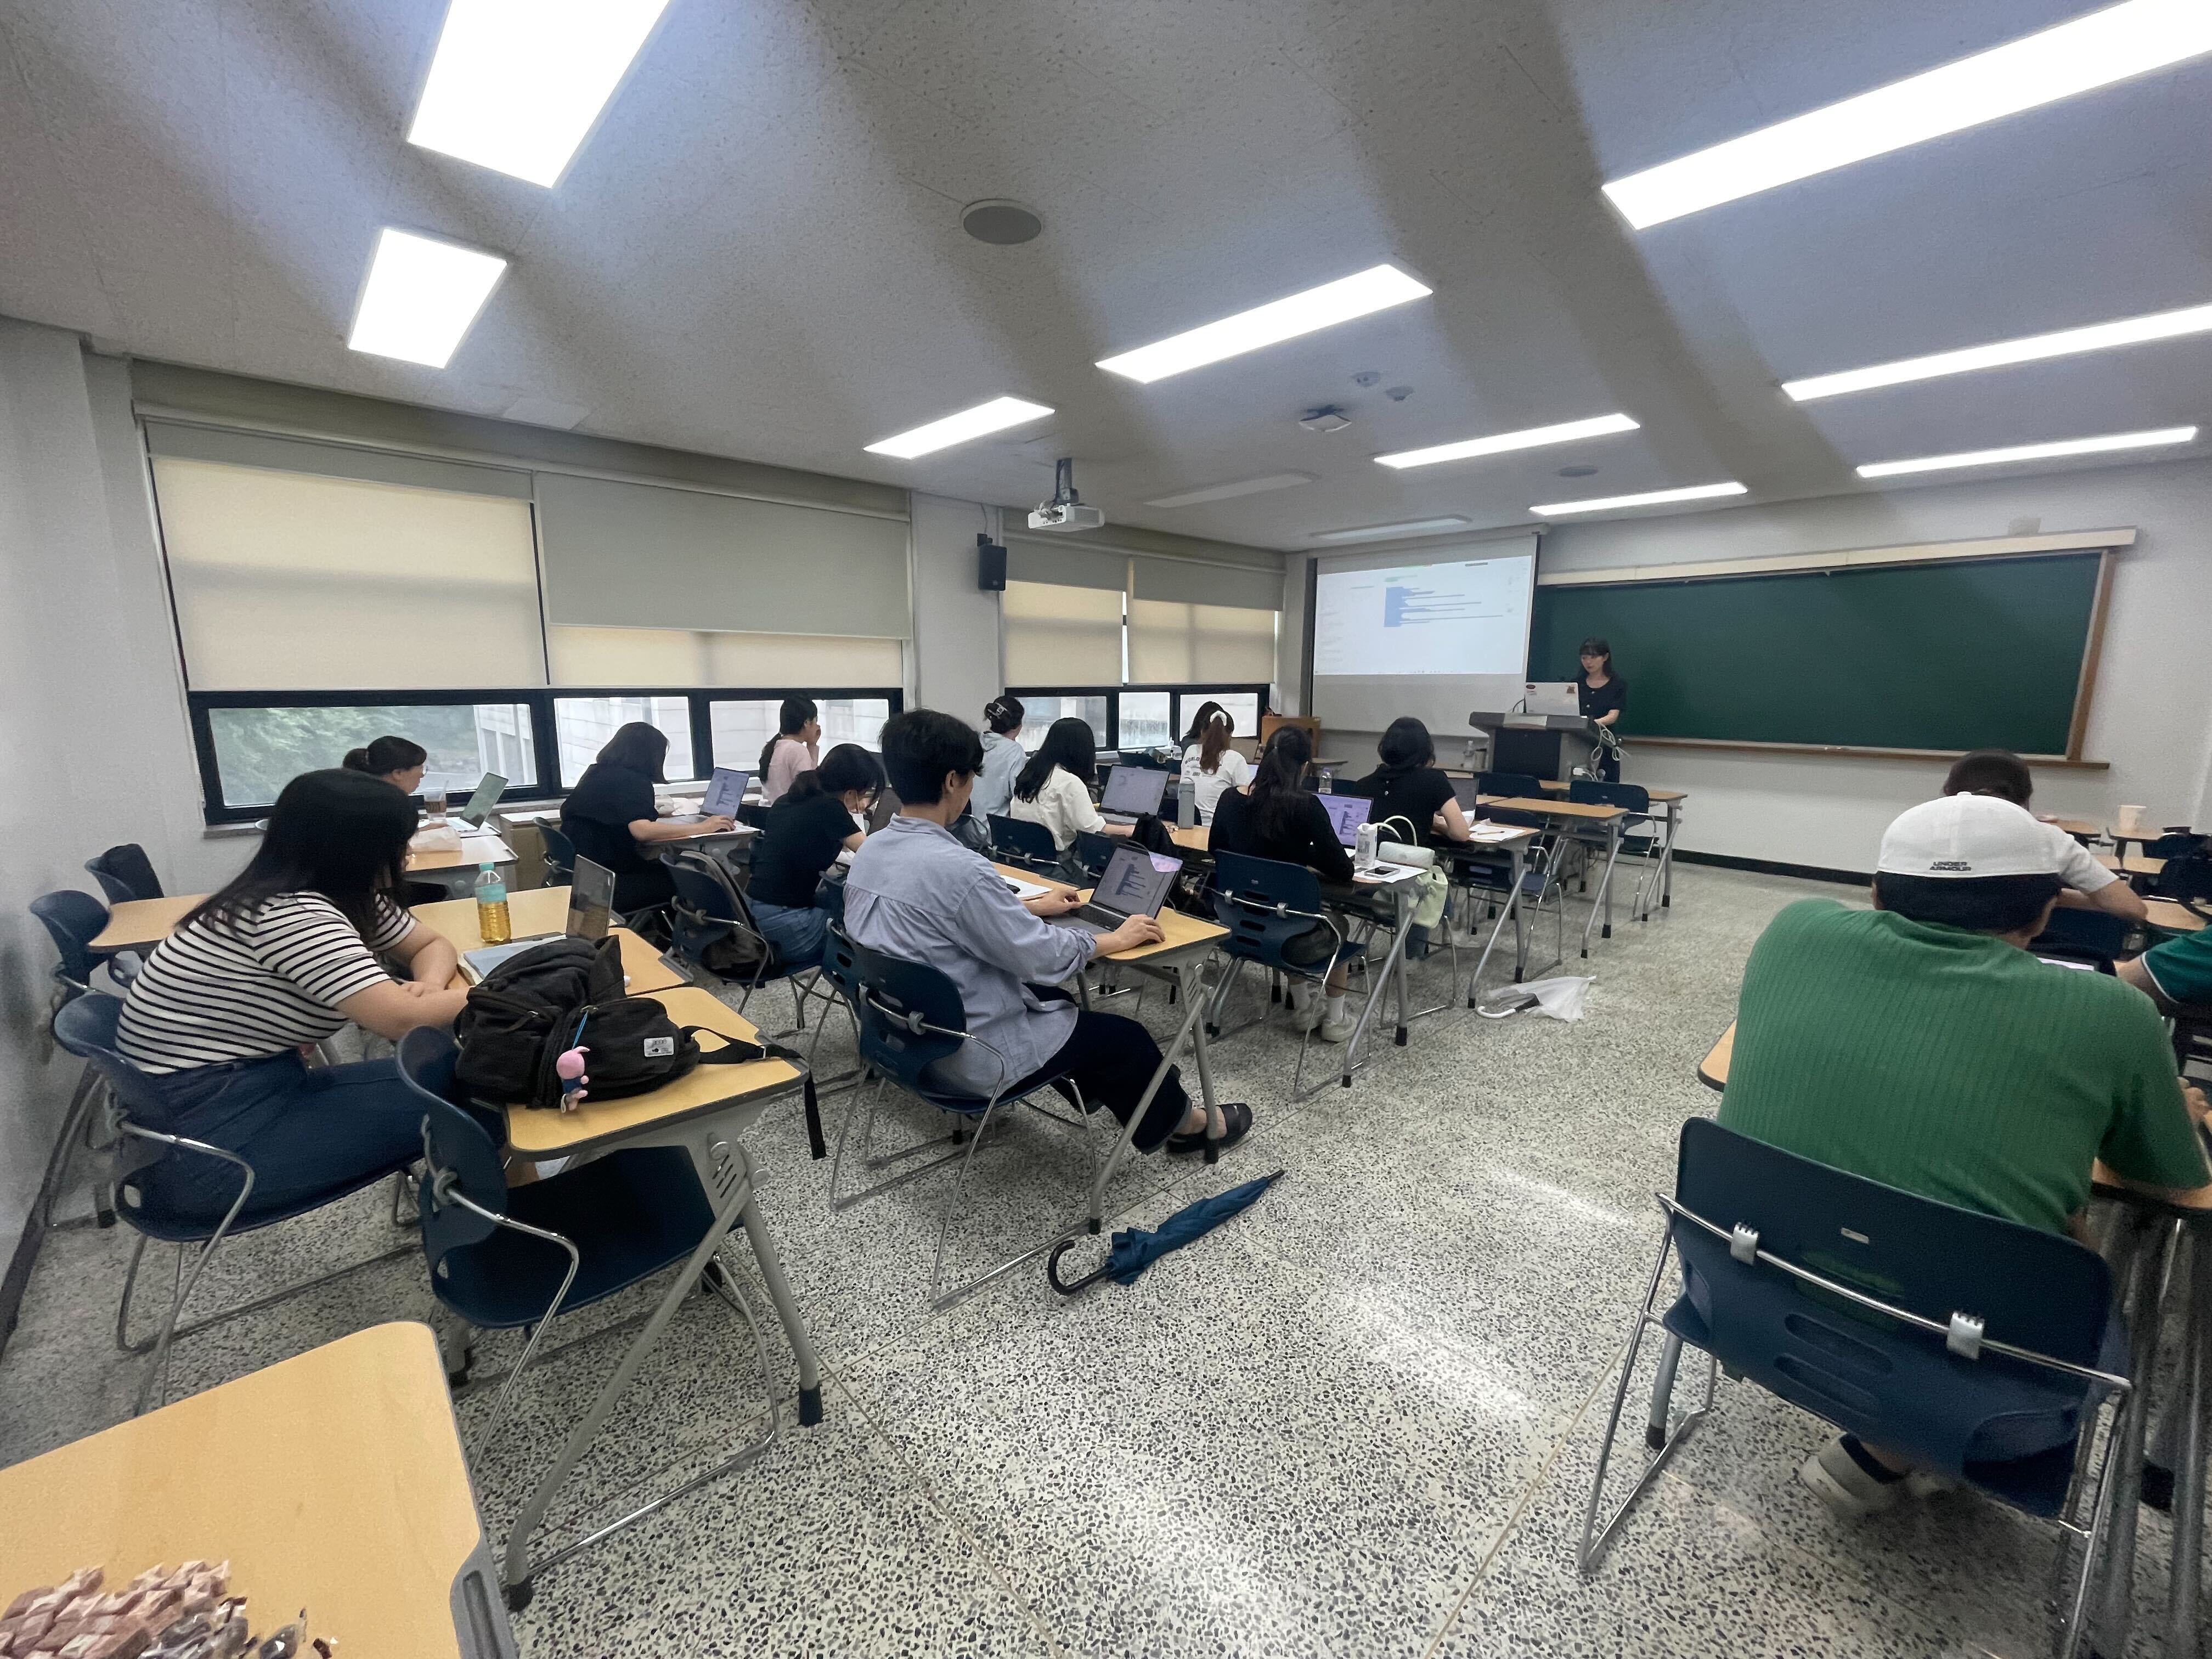 A full classroom of attendees works through the tutorial exercises.